
Most schools have published their results by now, although some results are preliminary, but we are releasing the top 80 London secondary schools based on % of A* grades at GCSE already. It looks like the new tougher GCSE have benefitted the most academic schools in the country, as many of them report record results.
The top five schools are unlikely to change, but we will add further schools as more detailed results are released. St Paul’s Girls’ School takes the top spot again this week, following its top spot in the A-Level rankings last week. Only 732 pupils in the whole country managed a “clean sweep” of ten or more A* grades, but there were 77 such pupils are North London Collegiate School, 59 at the Westminster School, and 39 at the Latymer Upper School.
Despite the fact that the top spots are taken by the usual suspects, a few schools have done especially well this year. The Hampton School and Highgate have edged up in the rankings for GCSEs and A-Levels, and many GDST schools have had fantastic results, too! Follow this post for further updates. St Paul’s School will not release their results until November, but they have issued a press release that their percentage of A*’s and A*-A’s were highest in three years, from which we were able to estimate the school’s position.
| School | Type | Gender | % A* | % A*-A | |
| 1 | St Paul’s Girls’ School | private | Girls | 92.6% | 99.2% |
| 2 | North London Collegiate School | private | Girls | 87.3% | 97.2% |
| 3 | Godolphin & Latymer School | private | Girls | 85.5% | 97.5% |
| 4 | Westminster School | private | Boys | 85.2% | 97.1% |
| 5 | Henrietta Barnett School | state | Girls | 82.3% | 95.2% |
| 7 | King’s College Wimbledon | private | Boys | 80.6% | 95.9% |
| 8 | Tiffin Girls | state | Girls | 79.4% | 94.1% |
| 9 | City of London School for Girls | private | Girls | 79.0% | 95.0% |
| 6 | St Paul’s School | private | Boys | 78.5% | 96.1% |
| 10 | Habs Girls | private | Girls | 78.0% | 94.0% |
| 11 | Queen Elizabeth School, Barnet | state | Boys | 76.5% | 91.7% |
| 12 | Lady Eleanor Holles | private | Girls | 76.0% | 92.3% |
| 13 | JAGS | private | Girls | 75.0% | 92.0% |
| 14 | Hampton School | private | Boys | 74.0% | 93.0% |
| 15 | Notting Hill & Ealing High | private | Girls | 74.0% | 92.0% |
| 16 | Highgate | private | Co-ed | 73.7% | 92.2% |
| 17 | Putney High School | private | Girls | 73.1% | 92.1% |
| 18 | Alleyn’s Dulwich | private | Co-ed | 73.0% | 92.0% |
| 19 | Haberdasher Aske’s School for Boys | private | Boys | 72.0% | 93.4% |
| 20 | St Olave’s Grammar School, Bromley | state | Boys | 71.4% | 86.7% |
| 21 | South Hampstead High School | private | Girls | 71.0% | 89.0% |
| 22 | Wimbledon High | private | Girls | 70.9% | 92.1% |
| 23 | Latymer Upper | private | Co-ed | 70.0% | 90.0% |
| 24 | City of London | private | Boys | 67.9% | 90.5% |
| 25 | UCS, Hampstead | private | Boys | 66.1% | 87.5% |
| 26 | Wilson’s Grammar School, Sutton | state | Boys | 65.5% | 85.5% |
| 27 | Bancroft’s | private | Co-ed | 64.2% | 84.9% |
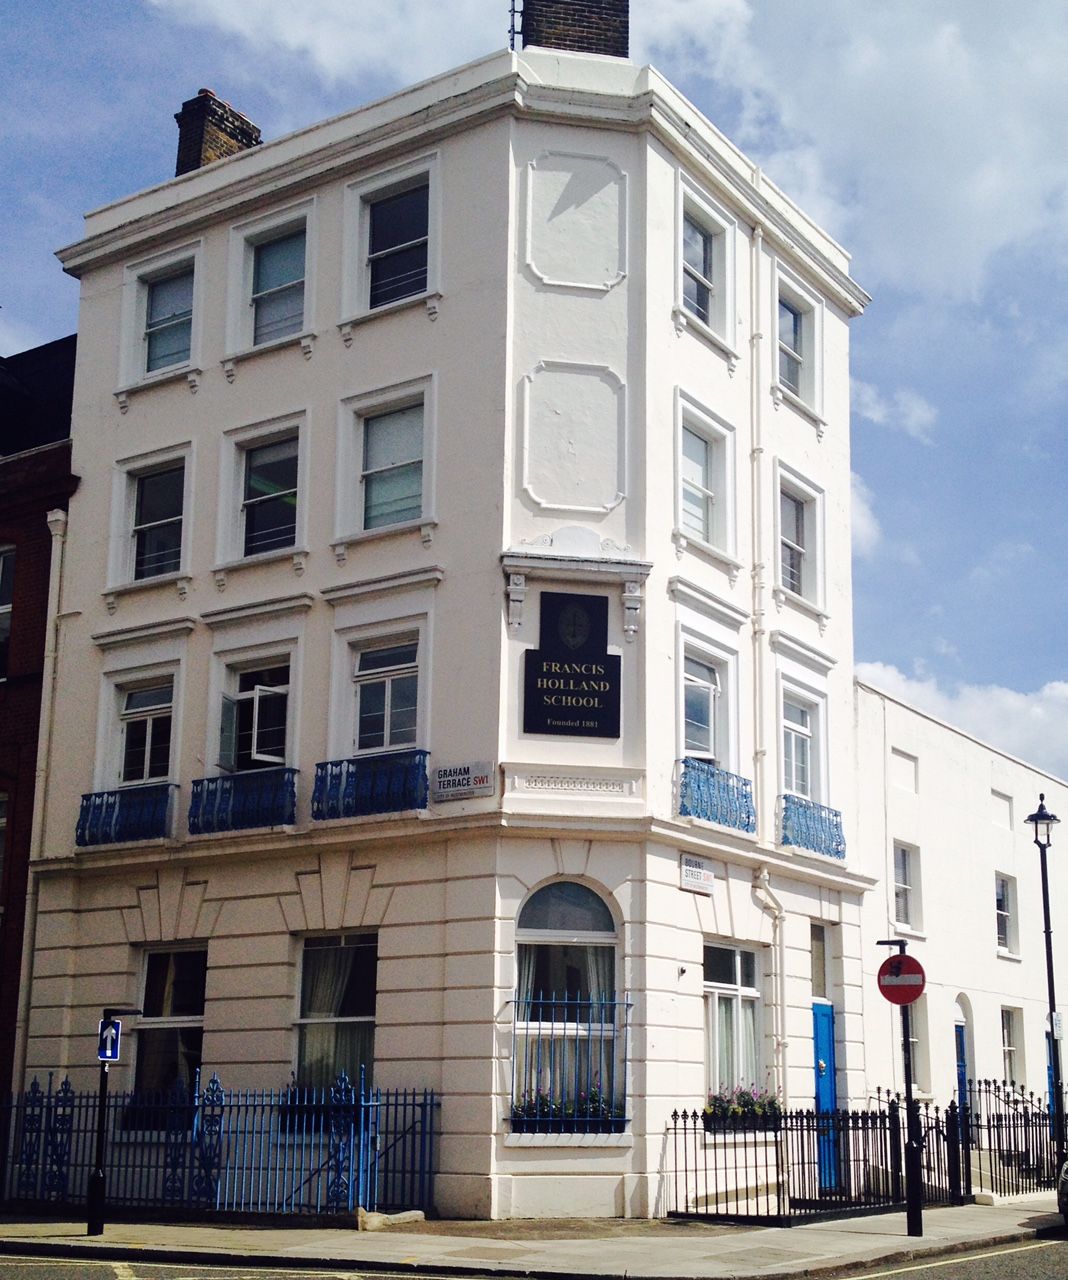
| 28 | Francis Holland SW1 | private | Girls | 63.0% | 83.0% |
| 29 | Newstead Wood School | state | Girls | 62.1% | 86.0% |
| 30 | Nonsuch High School, Sutton | state | Girls | 61.7% | 82.5% |
| 31 | St Michael’s Grammar | state | Girls | 60.7% | 82.0% |
| 32 | Sutton Grammar School | state | Boys | 60.3% | 80.5% |
| 33 | Channing School | private | Girls | 59.9% | 84.3% |
| 34 | Latymer School, Edmonton | state | co-ed | 59.1% | 83.3% |
| 35 | Kingston Grammar School | private | Co-ed | 58.0% | 85.0% |
| 36 | Trinity School, Croydon | private | Boys | 58.0% | 88.0% |
| 37 | Eltham College, Bromley | private | Co-ed | 57.5% | 84.2% |
| 38 | Tiffin School | state | Boys | 57.3% | 80.0% |
| 39 | Dulwich College | private | Boys | 57.0% | 84.0% |
| 40 | Ibstock Place | private | Co-ed | 56.0% | 83.0% |
| 41 | St Helen’s | private | Girls | 54.8% | 78.8% |
| 42 | Queen’s Gate | private | Girls | 54.3% | 80.5% |
| 43 | Forest School | private | Co-ed | 54.1% | 76.8% |
| 44 | Surbiton High School | private | Girls | 50.5% | 77.6% |
| 45 | Northbridge House, Canonbury | private | Co-ed | 50.0% | 70.0% |
| 46 | Croydon High School GDST | private | Girls | 50.0% | |
| 47 | Whitgift School, Croydon | private | Boys | 49.0% | 74.3% |
| 48 | Northwood College GDST | private | Girls | 47.7% | 70.8% |
| 49 | Wallington High School for Girls | state | Girls | 47.0% | 72.0% |
| 50 | Bromley High School GDST | private | Girls | 44.0% | |
| 51 | Francis Holland NW1 | private | Girls | 43.3% | 72.0% |
| 52 | St Augustine’s Priory, Ealing | private | Co-ed | 42.2% | 65.8% |
| 53 | Queen’s College | private | Girls | 41.8% | 70.4% |
| 54 | St James Girls’ School | private | Girls | 41.3% | 63.0% |
| 55 | Harrodian School | private | Co-ed | 40.5% | 66.7% |
| 56 | St Benedict’s School, Ealing | private | Co-ed | 40.4% | 66.0% |
| 57 | Lady Margaret School | state | Girls | 39.8% | 58.2% |
| 58 | Wetherby Senior School | private | Boys | 38.8% | 67.8% |
| 59 | Wallington County Grammar School | state | Boys | 38.6% | 63.2% |
| 60 | Emanuel School | private | Co-ed | 38.0% | 63.6% |
| 61 | Colfe’s School | private | Co-ed | 37.8% | 60.8% |
| 62 | Blackheath High School GDST | private | Girls | 37.0% | |
| 63 | Northbridge House, Hampstead | private | Co-ed | 34.0% | 56.0% |
| 64 | Sutton High School | private | Girls | 33.5% | 55.3% |
| 65 | Mill Hill School | private | Co-ed | 32.4% | 56.8% |
| 66 | Ashbourne College | private | Co-ed | 32.4% | 50.5% |
| 67 | Cardinal Vaughan Memorial School | state | Co-ed | 28.7% | 55.4% |
| 68 | Greycoat Hospital | state | Girls | 28.4% | 49.3% |
| 69 | The London Oratory School, Fulham | state | Boys | 28.2% | 47.8% |
| 70 | Camden School for Girls | state | Girls | 28.1% | 49.2% |
| 71 | Graveney | state | Co-ed | 27.9% | 48.2% |
| 72 | Bexley Grammar School | state | Co-ed | 27.4% | 51.0% |
| 73 | Alexandra Park School, Haringey | state | Co-ed | 26.3% | 43.8% |
| 74 | St Marylebone | state | Girls | 26.0% | 45.0% |
| 75 | Waldegrave School | state | Girls | 25.9% | 43.8% |
| 76 | Fortismere School | state | Co-ed | 24.0% | 42.0% |
| 77 | Mossbourne Academy | state | Co-ed | 21.3% | 36.0% |
| 78 | Grey Court School | state | Co-ed | 20.3% | 40.0% |
| 79 | Coombe Girls School, Kingston | state | Girls | 20.0% | 36.2% |
| 80 | West London Free School | state | Co-ed | 19.8% | 34.5% |
Hi there
Do you have any info on Heathfield House in Chiswick?
Thanks so much
Philippa
Can we get an updated list please? Lots of schools missing.
What about woddford school for girls ?
Where is forest school it’s in London
Hi – any reason why Merchant Taylor has not been listed?
Please where is kingsdale foundation school’s results?
WHeres chigwell school??
Where’s Brentwood school???
Where’s Chelmsford County High School for girls??
Where’s Woodford county high school for girls ??
You haven’t included Streatham & Clapham High School results for 2018 – 38% A* and 66.2% A*-A. This is a London based school and part of the GDST group of schools
Where’s Colchester County High School for girls
Colchester is not located in London, this is a ranking of London schools only.
Any reason why Dartford Grammar School Boys is not on the list?
this is a ranking of London schools only.
Hi there please are you able to add comparable figures for Palmers Green High School, Ashmole Academy and At Anne’s Catholic High School?
Where does Holland Park school feature in this list?
they have not published the required data to be included.
How come Newstead Wood School is not on the list?
thanks, this has been updated. They had not released the results when the table was originally published.
Where is Paddington academy in London 2018
Paddington Academy has not published the % of A*’s or grade 8/9 GCSEs on their website. If you have the data, please share so it can be included.
Are these metrics showing the percentage of A* and A-A* grades among all grades achieved by pupils or the percentage of pupils who have achieved at least one A* or A-A* grade?
percentage of A* among all GCSE entries (so not percentage of students).
May I ask do you have Dame Alice Owen’s School’s results?
They have been published by the school, not included here as DAO is located in Hertfordshire. Here is a summary of their 2018 results:
“At Dame Alice Owen’s, we are thrilled that 30.6% of all new GCSE grades awarded were a grade 9, with a further 21.2% of examinations being graded 8 and 18.1% graded 7. With 20% of all legacy GCSEs (the old style ones) being awarded an A* and another 41.6% of these grades being awarded an A grade, that brings us to 69.4% of all grades achieved being 9-7(A*-A) compared to 67.5% last year.”
Hi Anke, do you know why some school don’t want to be part of the ranking below?
https://www.telegraph.co.uk/education/0/best-independent-schools-2018-full-league-table-gcse-results/
yes, for state schools or smaller schools it may be administrative / timing issues, for the well established ones it is mainly that they want to combat league table culture among parents, they want less schools to supply data so parents rely less on league tables and more on personal visits and a personal connection with the school.
How come Eltham College doesn’t feature in this list?
it has been added now, as mentioned the ranking is being updated as more results are released. Godolphin & Latymer is also going to be added shortly.
Will Caterham’s results be reflected?
To my knowledge, Caterham is close to London but not in London? This ranking is for London schools only
LEH results are not reflected
that is because they had not published the exact breakdown by last week, it has now been updated.